

ACL Digital
August 8, 2025
5 Minutes read
Real-Time Monitoring in Industrial Automation with BigQuery
In today’s connected world, industries are no longer confined to isolated machines and manual processes. Industrial IoT (IIoT) has revolutionized how factories, oil rigs, mines, and transportation systems operate by integrating smart sensors, connected devices, and powerful analytics platforms. But while data collection is easy, the real challenge is making sense of the vast streams of data these devices generate – and doing it in real time.
This is where Google BigQuery steps in. As a fully managed, serverless data warehouse, BigQuery is designed to handle massive volumes of data with speed and efficiency, making it an ideal choice for real-time IIoT monitoring. This blog explores how Google BigQuery’s powerful serverless analytics empower manufacturing and industrial enterprises to process massive data streams efficiently. Discover key features, architecture insights, practical use cases, and real-world success stories from ACL Digital’s implementations.
Why Real-Time Monitoring Matters in IIoT
Imagine a large manufacturing plant equipped with thousands of sensors constantly monitoring temperature, vibration, energy consumption, and machine performance every second. If a machine starts to overheat or vibrate abnormally, quick detection is critical to prevent costly downtime or safety hazards. However, traditional monitoring systems often struggle to keep up with the sheer speed and volume of IIoT data. They face challenges such as high latency, poor data integration, and limited performance scalability. This is where BigQuery excels. Its real-time processing capabilities effectively address these pain points, enabling industries to:
- Detect and prevent equipment failures
- Optimize operational performance
- Improve safety and regulatory compliance
- Enable predictive maintenance
- Make data-driven decisions instantly
Why Choose BigQuery for IIoT?
BigQuery offers unique advantages for IIoT applications:
- Scalability: Handles petabytes of data without infrastructure management.
- Real-Time Analytics: Processes streaming data instantly for actionable insights.
- Ease of Use: Uses familiar SQL queries, enabling faster adoption.
- Cost-Effectiveness: Pay-as-you-go pricing with no upfront infrastructure cost.
- Seamless Integration: Works smoothly with other Google Cloud services, creating an end-to-end IIoT data pipeline.
Key BigQuery Features for Real-Time Monitoring
BigQuery offers a suite of powerful features specifically designed for real-time monitoring, empowering industries to process massive data streams efficiently and derive actionable insights instantly.
Serverless and Scalable Architecture
BigQuery is a fully managed serverless data warehouse, eliminating the need to manage infrastructure. It automatically scales to handle workloads ranging from terabytes to petabytes, allowing organizations to focus on data analysis rather than resource management.
High-Speed Real-Time Data Analytics
Designed for fast, complex analytical queries, BigQuery processes large datasets in seconds. Its streaming API enables real-time ingestion of data from sensors, machines, and IoT devices with minimal latency. This allows industries to monitor operational data instantly, detect issues such as equipment bottlenecks, and act proactively to prevent downtime.
Event-Driven Architecture Integration
BigQuery integrates seamlessly with Google Cloud Pub/Sub for event-driven processing. When events occur—such as abnormal vibrations in machinery or temperature spikes—Pub/Sub streams the data into BigQuery, which processes it in real time and triggers alerts or automated responses to ensure operational safety and efficiency.
Continuous Queries for Live Dashboards
With continuous queries (preview), BigQuery allows SQL queries to automatically update as new data arrives. This feature is ideal for live dashboards used by operations teams to monitor up-to-date metrics without manually rerunning queries.
Change Data Capture (CDC) with Datastream
BigQuery integrates with Datastream to stream real-time updates from legacy systems (ERP, CRM, industrial control systems), providing a unified, current view of operational and business data. This enables comprehensive monitoring, data consistency, and faster decision-making.
SQL-Based Queries and Familiarity
BigQuery supports industry-standard SQL, making it accessible to existing data analysts and engineers without requiring them to learn new query languages.
Machine Learning and AI Integration
With BigQuery ML and Google AI tools, organizations can build, train, and deploy machine learning models directly within BigQuery. This enables Predicting equipment failures before they occur, Optimizing maintenance schedules to reduce downtime, Detecting anomalies for proactive interventions, Using natural language queries for intuitive data access by non-technical users.
Cost-Efficiency
BigQuery operates on a pay-as-you-go model, ensuring businesses only pay for the storage and queries they use, reducing operational costs while delivering high-performance analytics.
Robust Security and Compliance
BigQuery offers strong security features, including data encryption at rest and in transit, along with compliance with standards like GDPR, HIPAA, and PCI DSS, ensuring data privacy and regulatory adherence.
Data Sharing and Visualization
BigQuery integrates with Google Data Studio and other visualization tools for effective reporting and dashboarding. It also supports easy and secure data sharing across teams or external partners with fine-grained access controls.
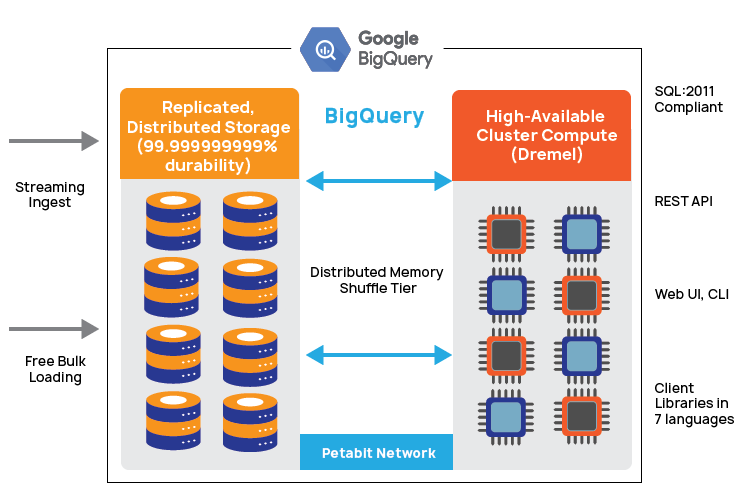
Understanding How BigQuery Works
BigQuery operates on a serverless architecture where storage and compute resources are decoupled. This design allows users to rapidly import datasets of any size and begin analysis without worrying about infrastructure limitations.
Here’s how the architecture works:
- Columnar Storage with Capacitor: Unlike traditional relational databases that store data row by row, BigQuery stores data column by column using a format called Capacitor. Each column is kept in its own file block, enabling extremely high throughput essential for live analytical processing.
- Colossus – The Storage Backbone: Colossus manages BigQuery’s storage. It is Google’s global distributed file system capable of handling massive volumes of structured data, ensuring replication, fault recovery, and distributed data management efficiently.
- Dremel – The Compute Engine: Dremel handles query computation. It operates as a multi-tenant cluster that converts SQL queries into execution trees. The smallest units in these trees are called slots, and BigQuery allocates thousands of slots per user to execute queries swiftly.
- Jupiter – High-Speed Data Transfer: Jupiter manages the data transfer between Colossus (storage) and Dremel (compute). This petabit-scale network facilitates fast and efficient data movement, ensuring low-latency analytics.
- Borg – Resource Allocation Manager: Borg is responsible for managing hardware resources. As Google’s cluster management system, it allows BigQuery to perform hundreds of thousands of jobs concurrently, ensuring seamless scalability.
Applications and Use Cases of BigQuery in Manufacturing & Industrial IoT
BigQuery unlocks powerful data analytics capabilities for manufacturing and Industrial IoT, enabling real-time insights and smarter operations. Its scalability and seamless integration drive a wide range of applications and use cases, as outlined below.
Real-Time Analytics
Supports streaming data ingestion for real-time monitoring and decision-making, such as tracking website visitor behavior or sensor data from IoT devices instantly. For example, factories use BigQuery’s streaming ingestion to analyze sensor data in real time, monitoring machine temperatures and vibrations to detect anomalies and avoid unplanned downtime.
Machine Learning Integration
Enables building and running ML models directly within BigQuery (BigQuery ML) for use cases like demand forecasting, churn prediction, and sentiment analysis. For example, using BigQuery ML, manufacturers build predictive maintenance models that forecast equipment failures based on vibration and temperature data collected from Industrial IoT sensors.
Predictive Analytics
Uses historical data to forecast future outcomes, such as predicting sales trends, equipment failures, or supply chain disruptions. For example, A steel plant uses historical production and maintenance data in BigQuery to predict optimal maintenance schedules, reducing unexpected shutdowns and extending machine life.
Data Warehousing and BI Reporting
Acts as a centralized data warehouse to store and analyze data from multiple sources, enabling advanced business intelligence reporting and insights. For Example, A manufacturing company centralizes production data, maintenance logs, and supply chain information in BigQuery to create unified BI dashboards for operations managers, enabling better inventory planning and cost analysis.
Big Data Analysis
Efficiently handles massive datasets for complex analytical queries, making it ideal for analyzing customer trends, market data, or operational metrics. For Example, Automotive manufacturers analyze terabytes of data from assembly line sensors to identify bottlenecks in production processes, improving throughput and efficiency.
Data Integration Across Systems
Integrates seamlessly with Google Cloud services and external sources (e.g. CRM, ERP, IoT) for unified data analysis and cross-functional business insights. For Example, A factory integrates its ERP, MES (Manufacturing Execution System), and IoT sensor data into BigQuery for a unified view, enabling end-to-end process optimization and executive decision-making.
Geospatial Analysis
Provides built-in GIS functions to analyze location-based data, supporting use cases like mapping customer distribution or optimizing logistics routes. For Example, Logistics teams use BigQuery GIS functions to optimize delivery routes for raw materials to plants or finished goods to distribution centers, minimizing transportation costs and delays.
Real-World Case Studies: ACL Digital’s Industrial Automation Implementations
A US-based leading manufacturer needed a modern, real-time production monitoring solution to improve machine utilization, track OEE, and gain actionable insights while replacing their legacy system.
Challenges
- Lack of real-time machine data collection and visibility
- Manual downtime tracking causing delays and errors
- Inability to automate OEE calculations across production levels
Solution Implemented by ACL Digital
ACL Digital installed data acquisition devices to enable real-time machine data collection and automated OEE calculations at machine, cell, and plant levels. They deployed smart measuring views near machines to display live production metrics, enabled operators to log downtime reasons for accurate analysis, integrated shift-wise production planning with multi-level dashboards for comprehensive monitoring, and provided downloadable reports for key performance indicators such as OEE, Cycle Time, and Downtime, ensuring complete visibility and operational efficiency.
Outcomes
By automating production report generation, ACL Digital saved the client over 25 hours per month, while enabling real-time OEE monitoring and remote plant performance tracking. This solution also improved visibility with accurate data on cycle time, downtime reasons, and production counts, empowering faster and more informed decision-making.
Another US-based leading manufacturer required a reliable, real-time factory floor monitoring system to reduce unplanned downtime, ensure product quality, enable traceability, and integrate seamlessly with MES and ERP systems.
Challenges
- No real-time production data visibility
- Frequent unplanned downtimes
- Disconnected systems reducing quality and efficiency
Solution Implemented by ACL Digital
ACL Digital deployed a Plant Floor Information System (PFIS) integrated with an Ethernet-based Data Acquisition Card and Gateway, enabling real-time data collection and predictive maintenance capabilities. The system detected potential equipment failures for proactive maintenance scheduling, monitored product quality with automatic deviation alerts, and maintained detailed traceability logs to ensure compliance and streamline recalls. Additionally, it integrated seamlessly with MES, ERP, and PLM systems to ensure smooth data flow across the enterprise, ultimately improving production planning and operational efficiency through synchronized systems.
Outcomes
The solution reduced unplanned downtime by up to 30% through predictive maintenance, improved product quality with a 20% faster response to deviations, and achieved 100% traceability compliance, enabling quicker audits and streamlined recalls.
Conclusion
Real-time monitoring in Industrial IoT is transforming traditional operations into agile, intelligent ecosystems. Google BigQuery empowers industries to process massive data streams with speed and precision, enabling predictive maintenance, improved safety, optimized performance, and data-driven decision-making at scale.
At ACL Digital, we combine our deep expertise in Industrial IoT 4.0 and cloud engineering to help manufacturers and OEMs. From designing scalable data pipelines and real-time dashboards to integrating AI for predictive insights, we enable your business to achieve operational excellence and future-ready growth.
Ready to drive efficiency, innovation, and competitiveness in your industrial operations?
Contact us to build robust, data-driven Industrial Automation 4.0 solutions.